When it comes to the significant effects of water hammer in water conveying pipelines (water pumping mains), the situation of accidental stoppage of flow supplied by a pumping station is the one that represents, perhaps, the most unfavorable condition in the design and operation of the system.
This accidental stoppage of the equipment within a pumping station is usually caused by the unexpected power supply failure to their engines, generating there from pressure surges in the system that usually reach considerable magnitudes, thus compromising both the station and pipeline’s components physical integrity.
We will see in this article how Ariete offers a practical approach to estimating and comparing those surge pressures generated on a pumping pipeline system by water hammer occurrence when the failure of equipment in a pumping station takes place.
Pipeline’s Longitudinal Profile Creation
We have defined the Pipeline characteristics by entering the following information at the Pipeline Data dialog:

In addition, for the pipeline, in the case of the maximum allowable pressures that pipes can withstand, we have followed the steps related in this article in order to define piezometric head envelopes at steady flow conditions as well as at unsteady flow conditions, considering the case of cast iron pipes.
Pipeline’s Upstream Device: Pumping Station
The Pipeline’s water supplier Pumping Station to analyze in this water hammer calculation will consist of four similar Centrifugal Pumps with the characteristics summarized in the Pumping Station dialog→Data tab:

Since what we want to model is the sudden failure of the equipment at the Pumping Station, we have activated the Use Pumps’Inertia option to set 10 seconds from the simulation’s beginning as the starting rundown time. This will also make it possible to display the results during the first 10 seconds prior to the unsteady flow occurrence (Water Hammer pre-startup).
Operation tab at Pumping Station dialog is configured as follows:

Pipeline’s Downstream Device: Reservoir
The Pumping Pipeline in this water hammer example will be supplying to a fixed water level Reservoir (256 masl), along the simulation time, for which we have created the respective device from the Devices menu and entered constant water level value:

We now have all the information set for the water hammer calculation of the pumping pipeline system, so let’s begin!
Getting Envelopes of Water Hammer’s Maximum and Minimum Piezometric Heads
To perform the water hammer calculation with Ariete, simply click the Starts Unsteady State Calculation button from the software’s toolbar:
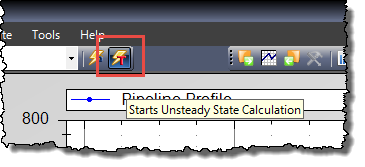
After a few seconds, the water hammer’s piezometric head envelopes (Max. and Min) will be shown in the Ariete’s main window:
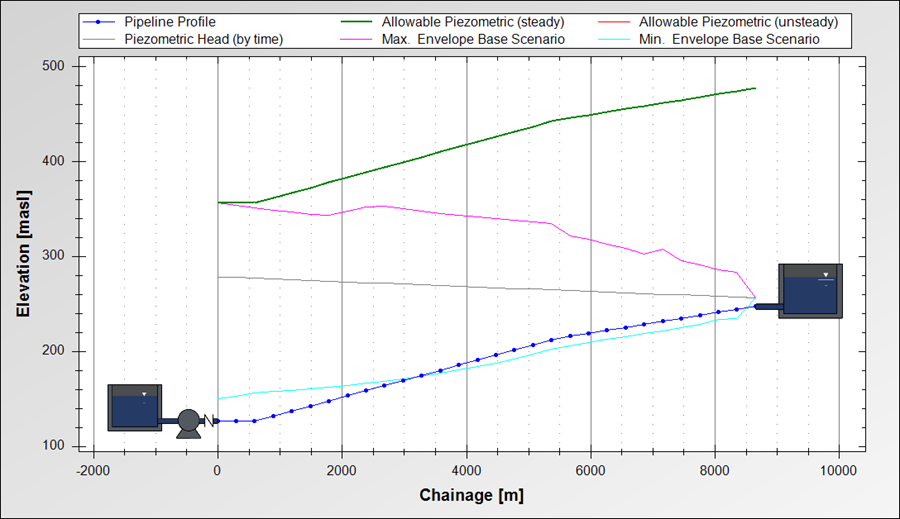
In which we see that the maximum calculated envelope is entirely below the envelope of Max. Allowable Piezometric Head (the one that the pipe can withstand, based on its Nominal Pressure), therefore not requiring the use of water hammer control devices at this level.
Visualizing Results at Specific Points In the Pipeline
In Ariete, it is possible to visualize results in tables and charts, along the chosen simulation time, for each of the control points in which the pipeline has been divided (there are 30 in this example).
To see the results, we must select the control point in question, by clicking on it at the pipeline’s Longitudinal Profile, and instantly view the hydraulic results, for the actual time step, in the Results panel:

To display the results charts, for example, the piezometric head at the selected control point, click on the Piezometric Head option under the Charts and Tables button:

Creating Combined Charts to Perform the Water Hammer Results Analysis
Another possibility, when results charts presentation is done with Ariete, is to choose, for the selected control point as referred in the previous section, another hydraulic parameter to be presented in the same chart but based in a secondary “Y” axis.
Let’s suppose that you want to display, together with the pressure head at the control point, the air volume evolution, along the simulation time, of the vapor cavity generated by water hammer (column separation phenomenon) at that point.
We will click on the Charts and Tables button at the Results panel and select the Pressure option. The chart is presented in the Ariete’s Results Chart dialog:
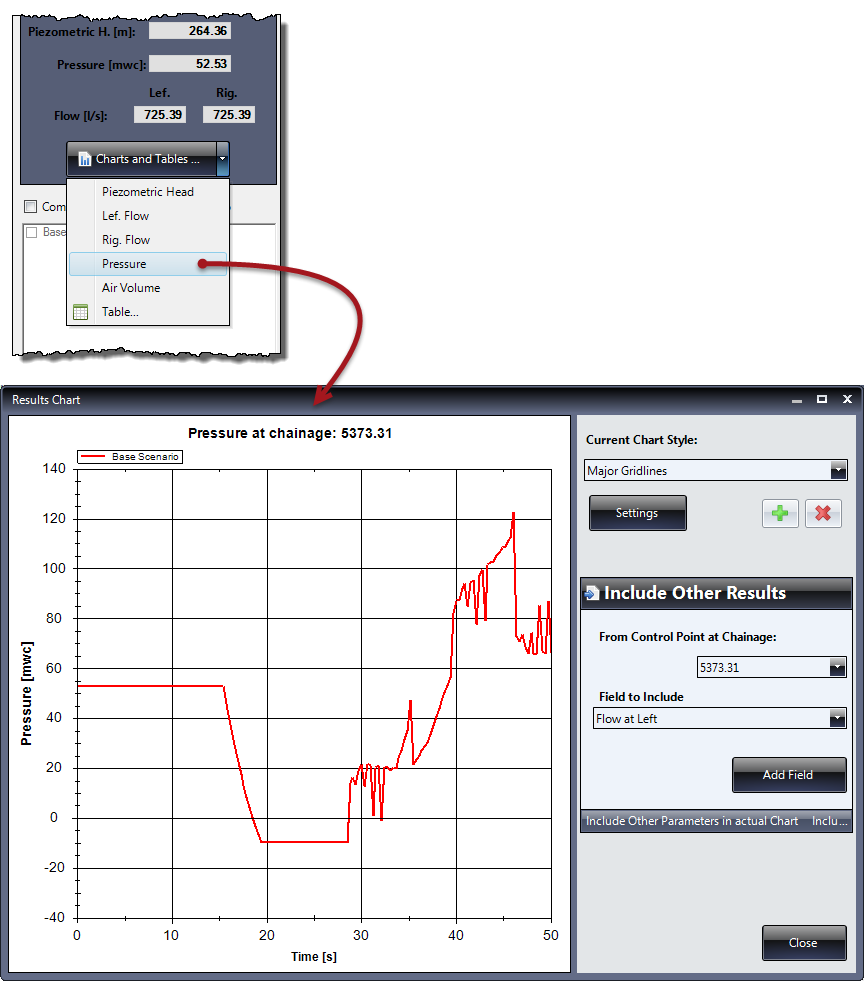
Note that in this dialog appears the “Include Other Results” panel, from which you can select not only another field or result to include in this chart for the same point, but can also include fields from another control point, selected according to its chainage within the pipeline’s length.
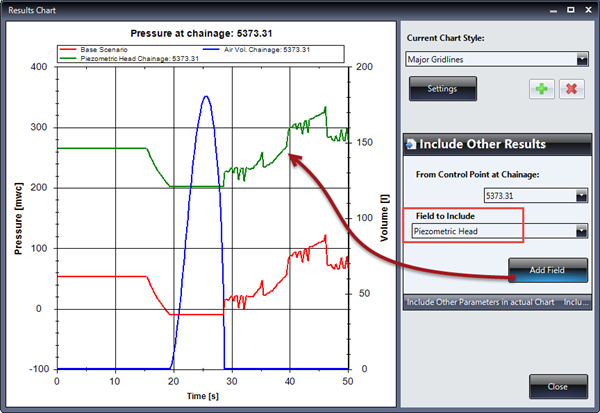
To add the volume of Air Volume field in this control point results chart, simply select this parameter from the “Field to include” list and click the Add Field button:

Thus, within our own Pipeline’s Water Hammer analysis, we will be able to establish that, in the specific case of the chainage 5373 m, cavitation (water column separation) starts approximately in second 18 from the simulation’s starting time, keeping this condition until second 29.
Presenting the Water Hammer Calculation results in Tables
Finally, the results at any control point and along the selected total simulation time can be presented by selecting the Table option inside the Charts and Tables button in the Results panel:
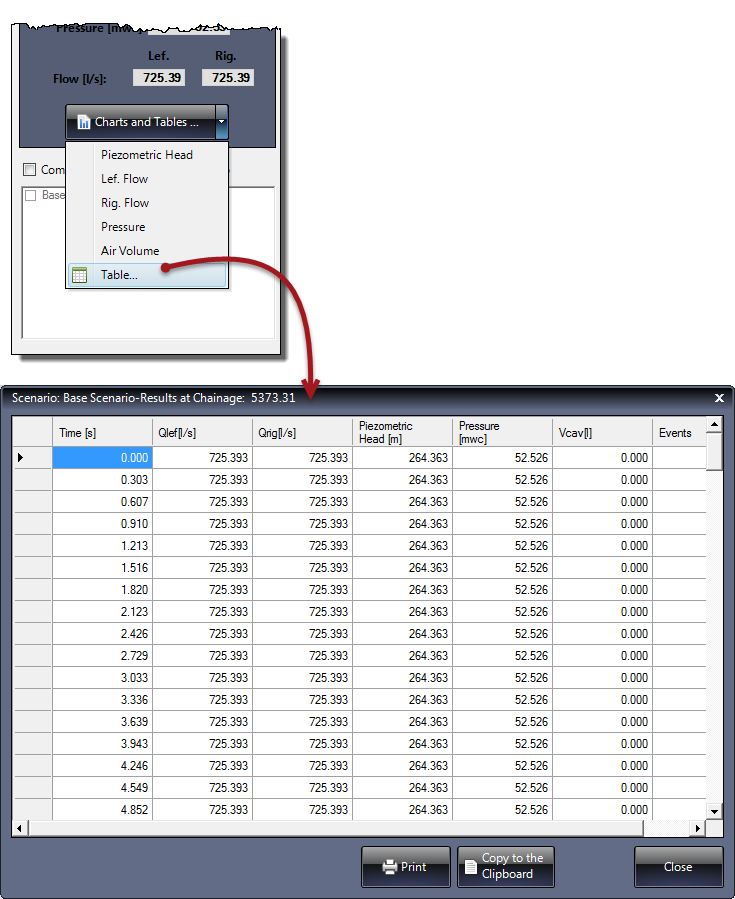
From which you can not only print the results table, but also copy the data to the windows clipboard for use in software such as Microsoft Excel®.
Thus, the pumping pipeline’s Water Hammer results analysis becomes easier using a practical and simple tool like Ariete. Give it a try!


