The Method of Characteristics implemented in Ariete, our water hammer software, requires that the pipeline under analysis be divided into a series of “Control Points,” on each of which the determination of parameters associated with the Hydraulic Transient phenomenon modeling takes place.
Therefore, it is important that you know the difference between what would be the Pipeline’s Real Longitudinal Profile and the one that Ariete will create – which we will call the Pipeline’s Analysis Profile – to meet the numerical stability requirements of the aforementioned Method of Characteristics.
When a new project is created in Ariete, the first thing to be done is to set the pipeline’s data in the Pipeline Data dialog:
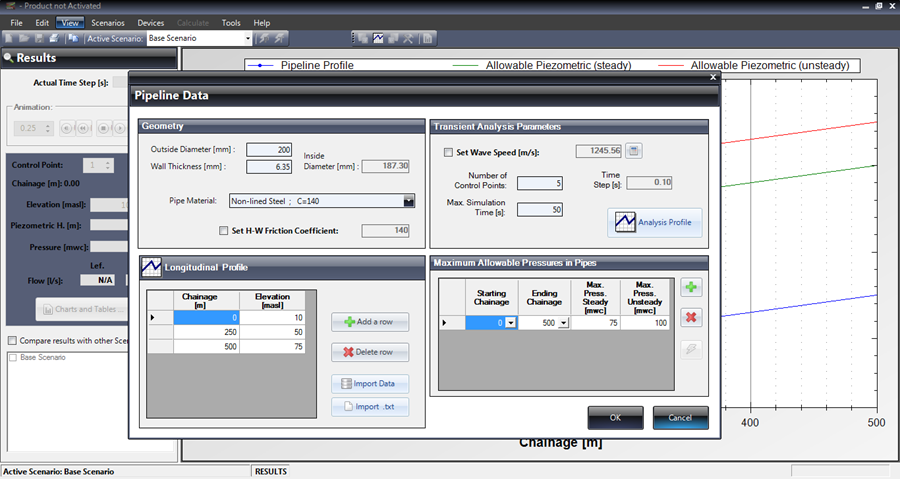
This dialog is divided into four groups:
Geometry Group:
In this group, you must specify “geometrical” parameters, such as the pipeline’s outside diameter, wall thickness, and the Hazen-Williams Friction Coefficient to be used for calculating friction losses in the system.
Specifying the pipe’s diameter and thickness is quite important in order for Ariete to perform the automatic calculation of pressure wave speed required for the water hammer analysis (on the dialog’s Transient Analysis Parameter group).
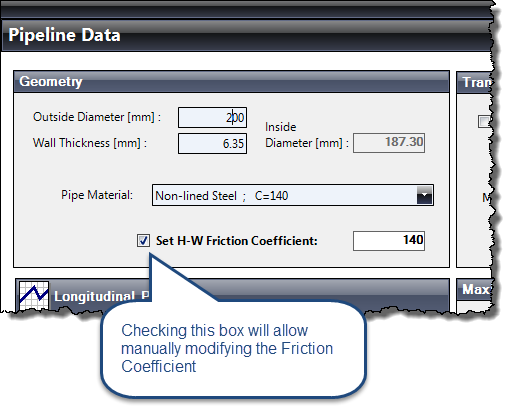
Even though Ariete shows a list of Pipe Materials (with and without lining) for the automatic selection of the friction coefficient, it is possible the user overrides it by checking the box at this group’s bottom:
Longitudinal Profile Group
In this group you can type, adding rows to the table, the values of chainages and elevations for the pipeline’s longitudinal profile (this will be the “Real” one, as has been referred to at the beginning of this tutorial).
Additionally, in case you have the Profile’s data in an Excel® format file, it is possible to import and create the Longitudinal Profile through the following sequence:
- Click on the Import Data button. The Data Base Importing dialog will be shown.
- Press the folder button in the Data source file to import box, to access the Select source file dialog, from which the import file format will be selected (.xls or .xlsx). Also, of course, the file with chainages data must be selected. Press the Open button to return to the Import dialog.
- From the Data Base Importing dialog, select the worksheet within the excel file containing the data, and then select the fields to import:
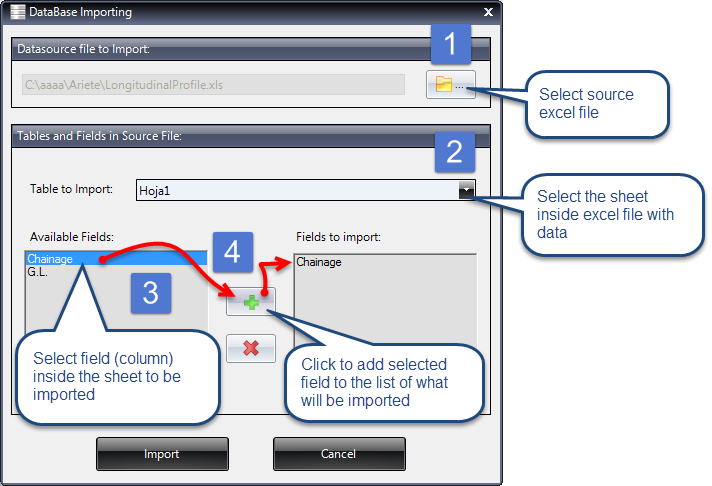
- After pressing the Import button, Ariete will perform the importing. If there are no problems in this action, an information dialog will be presented, indicating the number of imported records and asking the question of whether you want to preview the imported data in a table.

After the importing and having closed all dialogs, you will find the data in the table inside the Longitudinal Profile group:
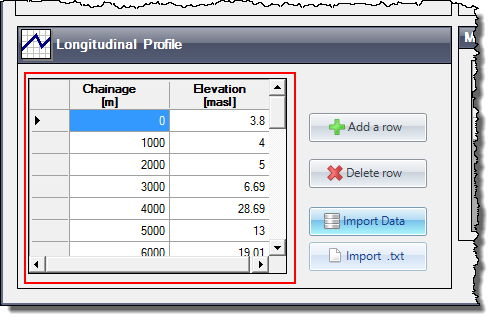
Once here, you can modify, add, or delete values.
Transient Analysis Parameters Group
The required water hammer calculation parameters are defined in this group. Not only is the Pressure Wave Speed value used in this calculation, but also the hydraulic transient simulation’s total time as well as the number of Control points on which the analysis is performed is set here.
As previously noted, the wave speed calculation is automatically performed, depending on the pipe’s selected material and its section’s geometric characteristics (diameter and wall thickness). But the option to override this automatic calculation is also available, so that the user can enter the desired value, through the Set Wave Speed checkbox:
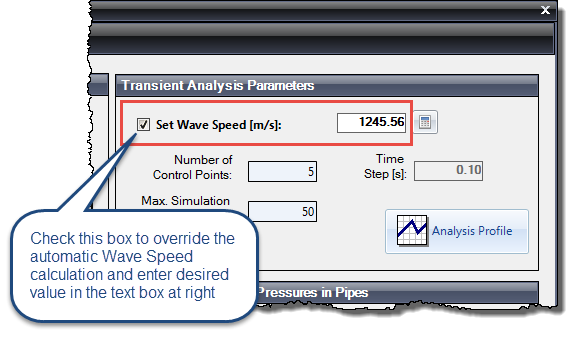
In the actual version of Ariete (1.1), the Wave Speed Calculator has been added. Please, for more information, read this article.
With regard to the number of Control points to be used, it is important to know that as the number of control points is greater, the lesser the Time step value to be used in the transitory analysis will be, thus achieving results that are visually “more uniform.” But it should also be noted that to the extent that this is so, the calculation time as well as the presentation of results, will also be higher (because of the amount of calculations and data to be processed by the software).
On the other hand, the selection of the number of control points must be such as to ensure that the generated Analysis Profile takes into account the points that the user considers critical for displaying results, these generally being the high and low points in the Real Pipeline Longitudinal Profile.
Let´s look at two cases in the following image:
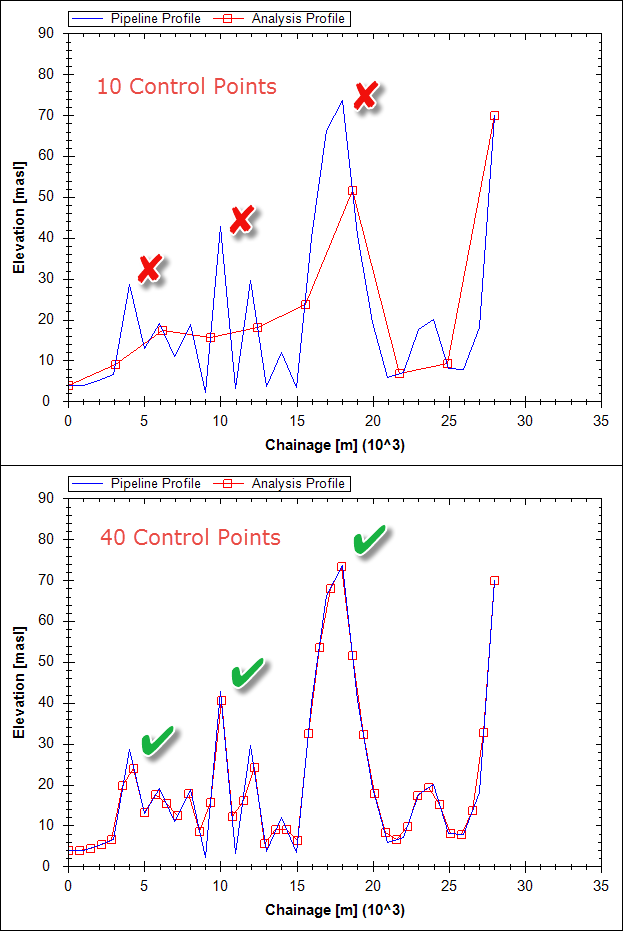
It is possible to understand that, from the previous image, to the extent that the number of control points is greater, the Analysis profile to be used by the method of characteristics in the water hammer calculation is more similar to the original (real) pipeline’s longitudinal profile.
Note that in the case of using ten control points, there are some high points of the original Longitudinal Profile that will not be taken into account in the analysis which could lead to errors in the results, when pressure heads that are not the real ones appear.
Therefore, it is recommended to “play,” changing the number of control points and clicking the Analysis Profile button until the desired result is achieved.
Maximum Allowable Pressures in Pipes Group
Another relevant feature in Ariete is the ability to plot the Pipeline’s Maximum Allowable Hydraulic Grade (Piezometric Head) envelope according to the rating pressure of the used pipes.
It is possible to indicate in this panel, for each section between Control Points, the rating pressures allowed for the pipe under two different analyses. In this article, we explain this feature in detail.
Thus, we set the Mechanical and Geometrical pipeline properties in an easy and very practical way.


