With PUMPS Online, we intend to offer a tool that allows easy viewing of the obtained results, such as the resulting pump head calculation in a system where the user is designing a pumping station with more than one equipment connected in series or in parallel.
Therefore, when you access the Results menu you will find, among other parameters, the corresponding system’s hydraulic characterization in a chart where the pump’s characteristic curves are plotted along with the system’s curve.
Results Page Components
As previously noted, the idea behind this page in our pump selection software is to graphically show the results of the analysis, specifically what is known as the pumping system characterization.
When you use the Calculate button of the Project page, assuming no errors were detected and that a system’s operating point is found, you will see the following information in the Results page:
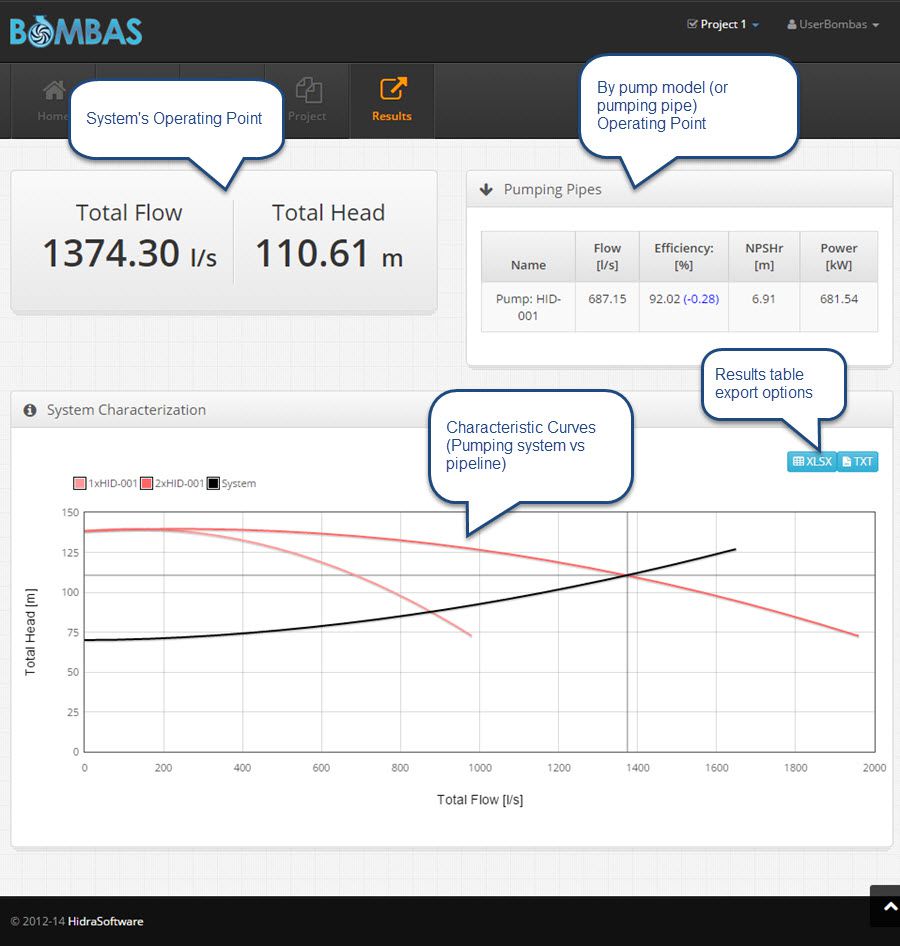
Pumping System (pumps and pipeline) Operating Point
The Total Flow and Total Head values correspond to what will be the solution of the whole hydraulic system in your actual project (Suction Pipeline – Pump(s) – Discharge Pipeline), i.e., the respective results for the operating condition you’ve specified for pumping pipes inside the pumping station. Thus, you’ll be able to establish whether, for example, it is possible to convey through the system a design flow when you connect certain number of pumps in parallel.
Operating Point for Each Centrifugal Pumps’ Model
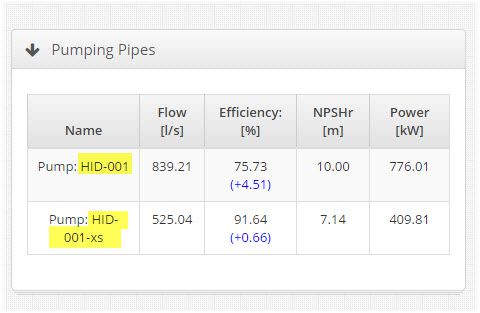
The table inside the Pumping Pipes panel presents the individual information of each active centrifugal pump (on its respective pumping pipe) within the current project.
That is, if you have three pumping pipes connected in parallel and the same centrifugal pump model is assigned to each line, this table will present the pumping flow and head (the pump’s operating point on its characteristic curve) that each equipment provides under this operative condition and, additionally, will offer the respective values for the efficiency, power and required NPSH.
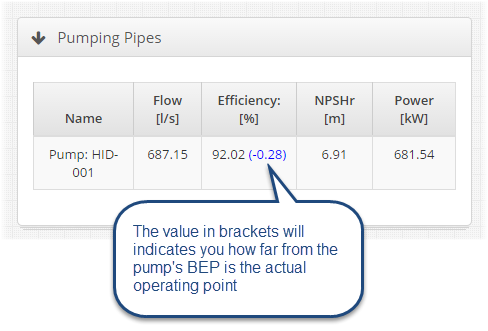
A very useful aspect in the pump selection process is to know how far, in percentage points, is the operating value of efficiency from the value that the manufacturer sets as the best efficiency point (BEP) on the pump’s characteristic curve. It is also important to know if the pump’s operating point is at the right or at left side of this BEP location on the performance curve.
This is why, besides the calculated efficiency, a value in parentheses telling you what this difference is in respect to the pump’s BEP has been included. When the aforementioned value includes a “+” symbol, it indicates that the operating point is located to the right of the BEP, and if it includes the “-” symbol, it indicates that it is located to the left of the best efficiency point on the characteristic curve:
System’s Characterization Chart
This chart is intended to simulate the creation process of the pumping system’s characteristic curve, i.e., the one that corresponds to the type of pump connection (serial or parallel) and is based on the number of simultaneously operating pumps (with the same and/or different characteristic curves) that you have set in your project. For example, the following figure shows the parallel combination of two pumping pipes with the same geometrical and physical characteristics, in each of which is installed a centrifugal pump Model HID-001:
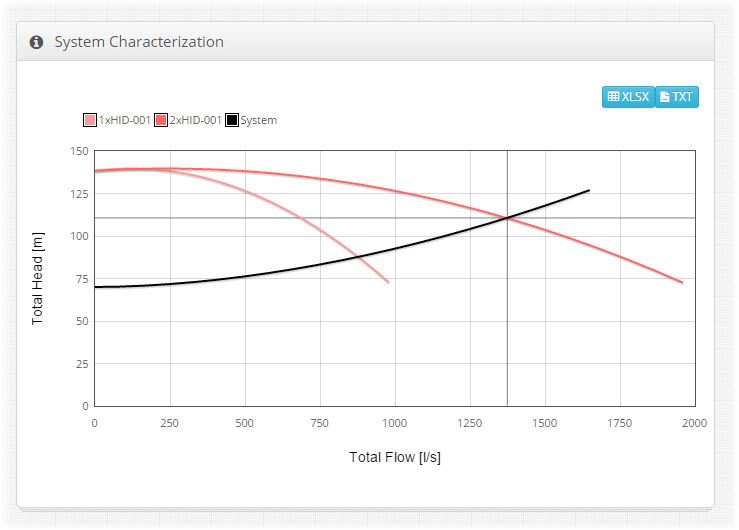
We see that the intersection of the pumping main’s characteristic curve (in black color) with the pumping system’s one (2xHID-001), gives the operating point of the pumping station (and, of course, the whole system’s operating point).
Another example, including the previous arrangement: two similar HID-001 pumps in parallel connection but now, another pump’s model is added, the HID-001-xs (in green color), of lower pumping capacity, so to obtain the pumping system’s characteristic curve (dark gray) for a total of three pumping equipments operating simultaneously. The respective chart is presented below:
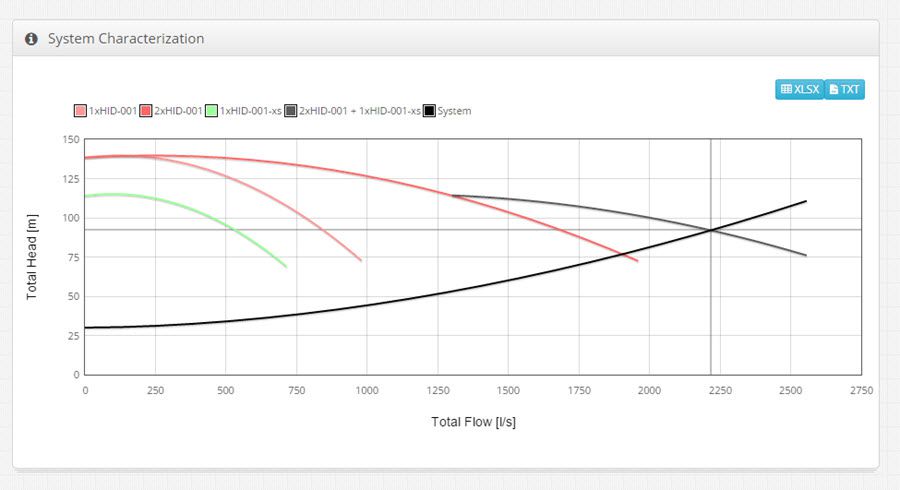
Thus, the results interpretation for any feasible operating condition in your project can be done very easily. This type of charts allows you to visually determine, among other things:
- The maximum number of centrifugal pumps (with the same or different characteristic curves) that ensures, operating simultaneously, the flow or head required to satisfy the design parameters of the system under study.
- To what extent it is profitable, in terms of pumping flow or head gain, to further increase the number of centrifugal pumps simultaneously operating.
- The visualization of the slopes along the pumping main’s characteristic curve will allow you to infer what kind of pump connection (serial or parallel) you should use. For example, curves with steep slopes at the point where the design flow is located, could suggest the connection in series, while those that are flatter certainly allow you to achieve the design value with the parallel connection.
This way you can see that PUMPS Online offers a simple and very educational alternative for understanding the hydraulic system operation, thus ensuring that the pump selection procedure in your designs is adequate.


