

With the most recent major update of our building’s drainage system design software, DESAGÜES (DRAINS), we have incorporated new enhancements regarding both its Interface and dialogs that make it up as well as the modelling tools related to the sanitary system’s modelling.
In this tutorial, we will show you the new features that you will find in this version, specifically in those regarding the Drawing Area that we have included, to detail the aspects to be taken into account when performing the building’s drainage system design.
At the moment all of our software includes a tab where, just like in a computer aided drawing (CAD) application, it is possible to perform the drainage system creation by drawing its sanitary and pluvial networks on it:

This drawing area, besides giving you the options for storm and sanitary systems creation by drawing their components, provides several tools or features such as the following:
1. You can use an AUTOCAD® Drawing file as a referencing Background Image
At the Background Image panel in the DESAGÜES’ DRAWING tab, you will notice that a button exists to allow you to select a DXF or DWG AUTOCAD® format drawing file in such a way to be used as a “base plan” in the building drainage system’s components drawing.
In Addition, you will see that the visualization (color, visibility, and line width) of the graphics entities within this background image can be modified through its Layers Manager:

Also the background image is used to perform the automatic assignment of sanitary and pluvial pipe sections’ length on each of the building drainage system networks that you have drawn on any DESAGÜES’ project, provided of course that the User defined Length property in the pipe’s dialog is set to false:

2. Modify the Display of the building drainage system networks’ components drawn in the Drawing Area
Just as with graphics entities visualization in the drawing file used as background image in your project, DESAGÜES’ objects are grouped into layers and hence you can handle their display properties in order to achieve a better graphical representation of the drainage system networks.
The Project’s Layers manager shows you the available layers:

In this dialog you will notice that, as well as with nodes and pipes, you can modify the display of the stormwater system’s catchment areas used to define diameters and longitudinal slopes in rain leaders and pipe sections that make up the building’s storm drain system.
3. Drawing Aids Tools: The GRID and Orthogonal Mode
To ease the drawing precision of the building drainage network’s components, you will find a couple of tools in DESAGÜES:
- The Orthogonal command restricts the cursor position to horizontal and vertical movements, when the pipes drawing command is active, and with respect to the last drawn pipe’s vertex. You can turn it On and Off by clicking the ORTHO button in the status bar or by using the F2 control key.
- The Grid visualization is toggle On and Off by clicking the GRID button in the aforementioned status bar, forcing the cursor location to its square’s vertices intervals:

To control the grid’s step as well as the major gridlines position (with a darker gray color) you can modify its properties in the Drawing Settings dialog, from the Drawing panel in the CONFIGURATION tab:

4. Displaying Results for building drainage system’s Pipe sections in the Drawing Area using Colors and Messages
The DESAGÜES’ feature of showing, at any time, a plan view of the sanitary or pluvial network on the drawing area, allows that the calculation and design results analysis can be performed using a user-defined color code for some properties. This color scale can be defined by clicking the button in the Tools panel at the DRAWING tab:

Thus it’s possible to set a range of values that will be linked to a specific color and, hence, visualize the results by “coloring” the lines that make up the pipe sections of the building drainage systems:

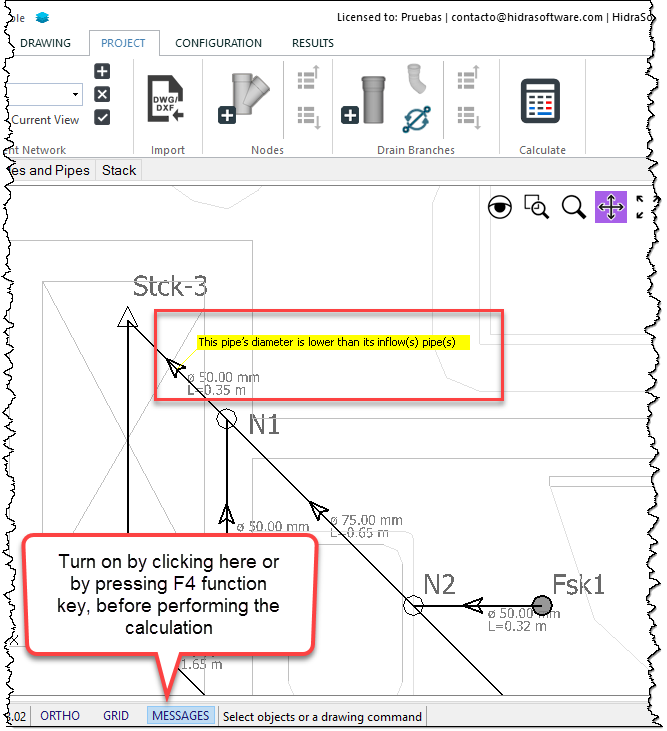
In addition, if you turn on the MESSAGES tool at the status bar (by clicking on the button or by pressing the F4 function key) and in the case errors in the design exist, warning messages will be shown for the corresponding sanitary or pluvial pipe sections:
5. Building Drainage System’s plan Drawings, including text Annotations
After performing the Calculation and design of your project drainage system’s components you will need, with the intent of generating the corresponding project’s drawing plans, to display results such as diameters, lengths, and slopes for each pipe section.
To do that you will find at the RESULTS tab, Annotations panel, a button that shows a dialog to configure the text annotations for some properties to be displayed for Nodes and Pipes of your building’s drainage networks; and, when the current network is of pluvial type, also you can generate annotations for the drainage areas:

In this dialog you will notice that two text sizes are required (fields at the lower right of the dialog):
- One size for text annotations to be used at the “minor” pluvial and sanitary networks,e. those that directly serve sanitary fixtures (in the case of sanitary water drainage) and the ones that include semicircular gutters (when dealing with pluvial water).
- Another size ideally greater than the previous one and that will be used for text annotations in the sanitary and pluvial building sewers.
Also take into account that these settings will apply for the isometric views generated from the Building Drainage System’s plan Drawings.
Once you have set the required annotations for the drawing plan in the aforementioned dialog, you will see them appearing on the drawing area:

This texts’ position can be permanently changed by selecting them and using the move command from the DRAWING tab.